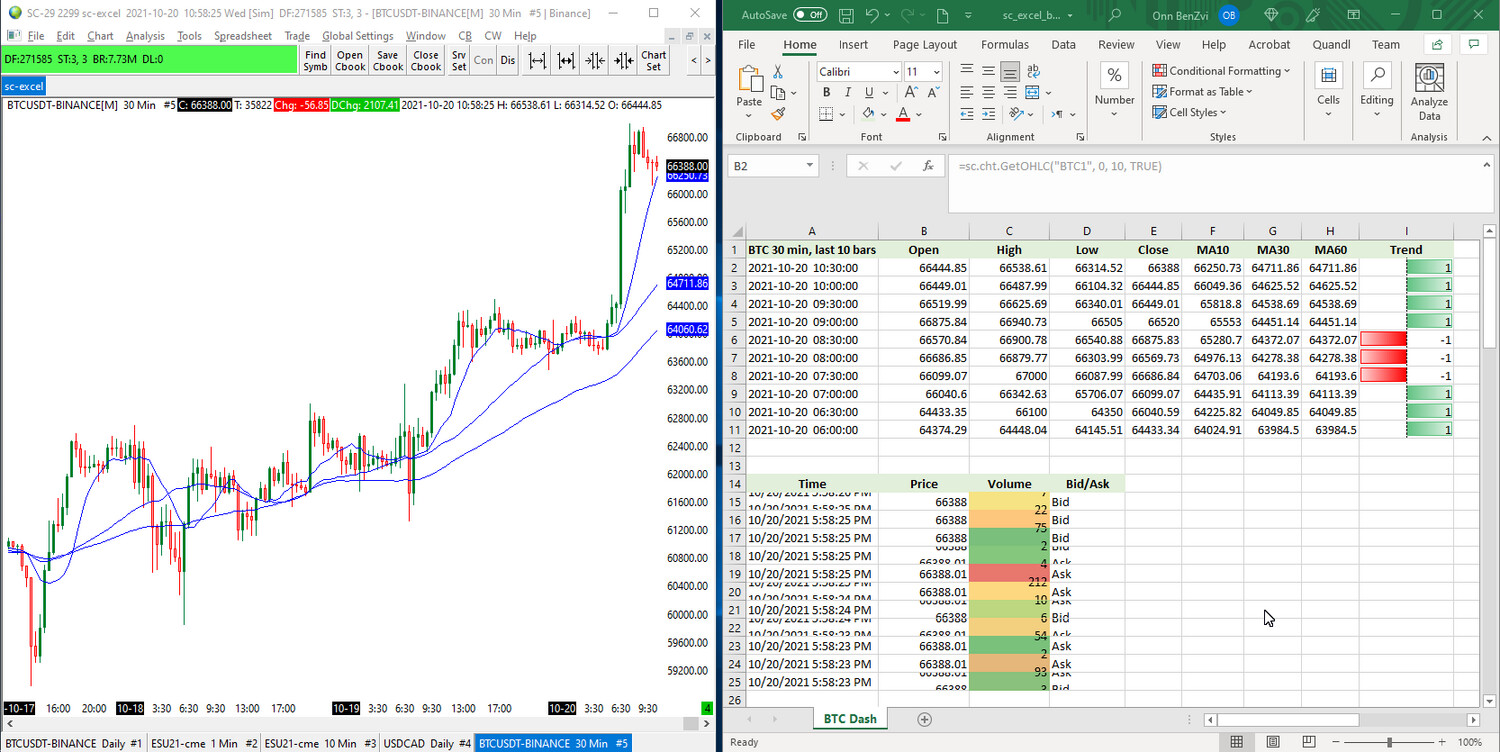
SierraChart-Excel
Product Details
Downloaded the files and it all appears to work just fine. I am pleasantly surprised as normally there is some fiddling around with things like this. But it just works.
Have been using Sierra Chart for years always wanted to build an Excel dashboard but didn’t know your program existed. Copilot found you - I thought I’d ask the question on the off chance and hey presto!
Colin
Overview
- Easily combine Excel with your Sierra Chart data to create your custom dashboards, calculations, graphs, etc.
- Stream L1 (Bid/Ask), L2 (Market Depth), Time and Sales, Last Trade with lookback window settings
- Supports bar based OHLC, Volume and any subgraph data
- Scalable, simple and efficient, no intermediate bridge software to run
The solution includes two files
- SC-Excel Cht AddIn - real time + historical, data is based on a chart
- SC-Excel custom study
When installed to Excel, the AddIns extend Excel with new user functions. These functions provide the ability to access Sierra Chart data directly in Excel.
SC Excel Cht AddIn
Access data that is chart based. Some examples include OHLC, subgraphs and volume. This AddIn requires a chart to be open with the relevant bar periods and studies applied. In general, any subgraph can be exported to exported to Excel.
Requirements
- Sierra Chart version 2308 or higher
- Excel 365
Docs
Display prices in:USD
