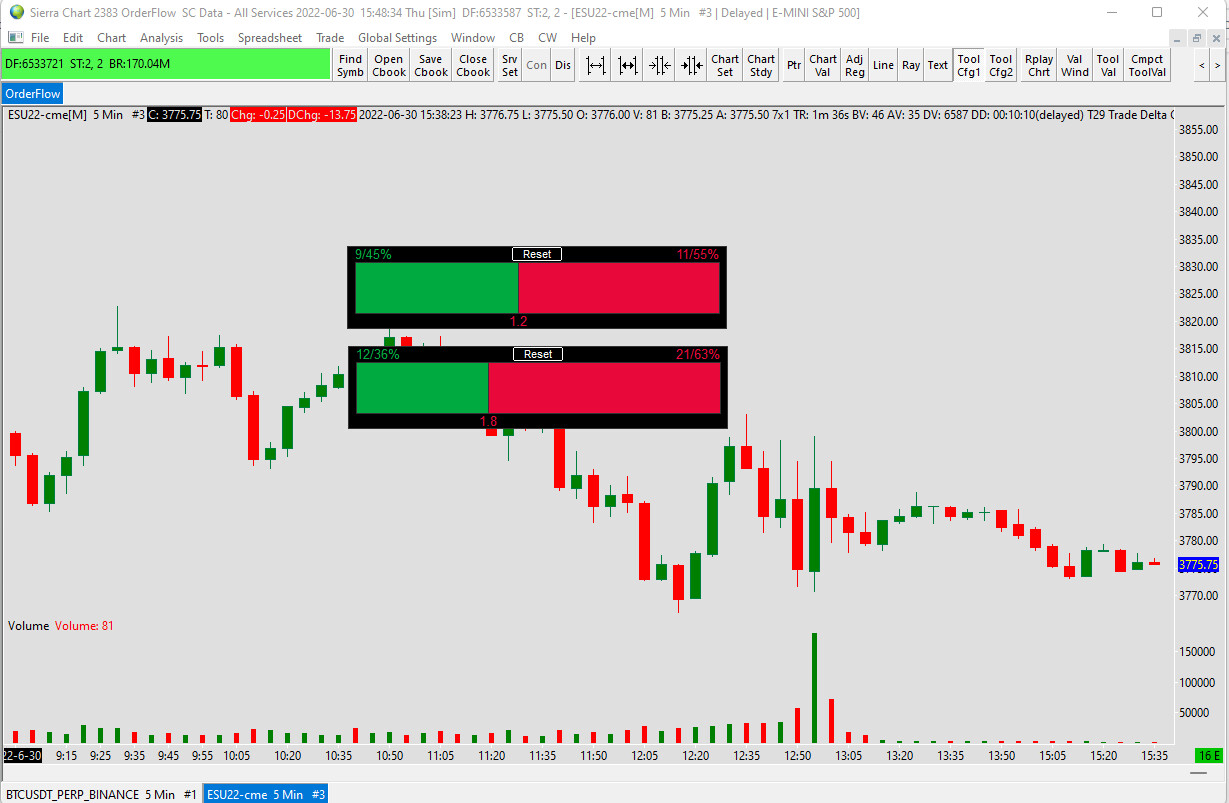
Order Flow Trades Imbalance Gauge
Product Details
Provides a quick and easy to see visual of the buying vs. selling pressure within the market.
The gauge tracks order flow time sand sales of trades, compares the accumulated buying vs. accumulated selling and posts the difference (delta) between them. The accumulation starts at some point in the past and gets updated in real time.
This is similar cumulative delta.
The gauge has two modes:
- Cumulative
- Rolling
Rolling mode
In rolling mode, users set the “Rolling Period”, in number of trades or seconds. For example say it is set to rolling with 60 seconds. With these settings the gauge will show the delta for the last 60 seconds and will update continuously.
Cumulative mode
The gauge displays the cumulative delta since some reset point. The reset point can be set in different ways as outlined below:
- Manually reset now - press the reset button at any time to start cumulating from this point in time and onwards
- At the start of each bar - resets on the first tick of each bar - in this mode, it shows the delta for the current bar
- From some bar - using the cross hair, select a bar, right click and hit the menu “T29 Delta Gauge: Start From Here” - the gauge will calculate the delta from that bar to the right and update as new trades come in
- Since the last position was entered - the gauge monitors positions for the chart symbol its applied to. Once it detects a new entry, it will automatically reset itself and start tallying the delta
Display prices in:USD
