Motivation
The breakeven price for a trader is one of the more important lines on the chart. It represents the line between winning and losing on the trade or on the day and is important to keep track of and be aware of.
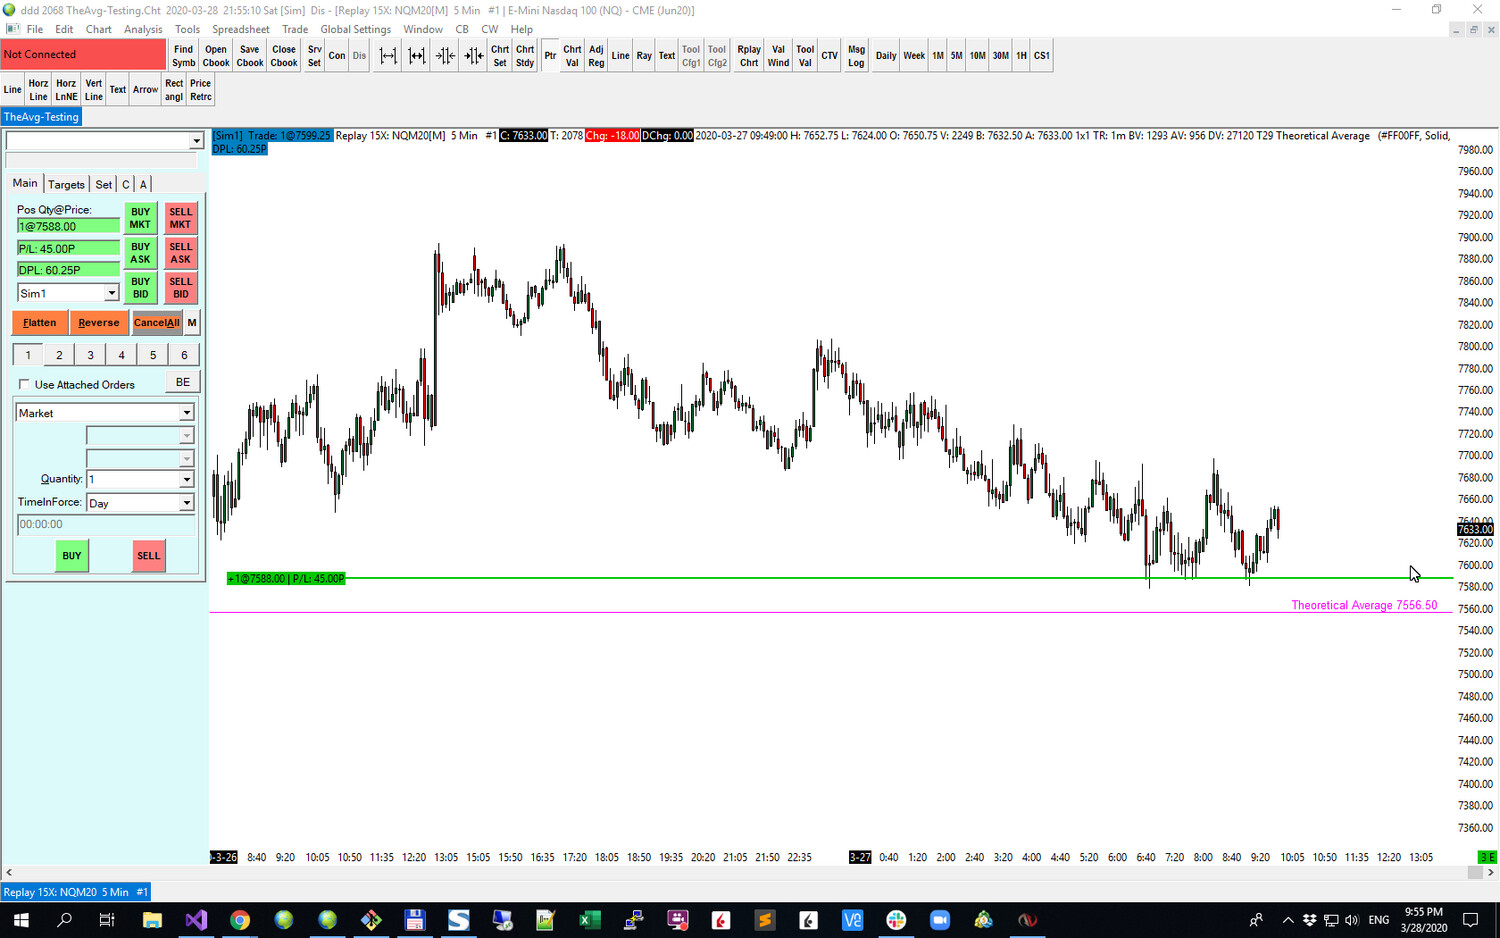
In the end, this breakeven line is a result of entries, exits and the commissions payed to your broker. The term Theoretical Average refers to the calculated average of these values.
Overview
During a trade, the study displays on the chart the breakeven line taking into account scale-ins and scale-outs. When there is a single entry (a single trade), this breakeven point is just that, the entry price. When scale-in's and scale-out's are involved in a trade, the calculation can get more complicated to do in real time. This study is a tool that assists just in that.
For example:
Enter +1 contract at 100 - line is drawn at 100
Price moves up to 110 and add another contract - line moves to 105
Price then moves up to 120 and we take off one contract - lines moves to 90
Why? if price goes below 90 we would be losing on the trade
The line is only displayed while a position is open.
When flat, it is not displayed
The above example is a basic example that does not include Round Turn Commissions (RT).
The study also supports a calculation that takes into account the full trading day's profit and loss.
Documentation
https://trade29.atlassian.net/wiki/spaces/GP/pages/75333969/T29+Theoretical+Average
